Advanced Filter Panel
Price Range
Categories
Brands
Color
Discount
Shipping
Availability
Active Filters
ElectronicsSonyBlackFree ShippingUnder ₹10,000
Hotel Booking System
Available Hotels
4 properties found
Grand Luxury Resort
Maldives
$450
/night
4.8
(1247 reviews)WiFiPoolSpaRestaurant

Mountain View Lodge
Swiss Alps
$320
/night
4.6
(892 reviews)WiFiSkiFireplaceRestaurant

Urban Boutique
New York
$280
/night
4.7
(2156 reviews)WiFiGymBarRoom Service

Tropical Paradise
Bali
$380
/night
4.9
(1834 reviews)WiFiBeachYogaSpa
3 nights × $450 =$1,350
Pivot Table Builder
Rows
RegionCategory
Columns
Quarter
Values
SalesGrowth
Filters
Status
E8
=SUMIFS($D$3:$D$12,$B$3:$B$12,"Electronics",$C$3:$C$12,">100000")+AVERAGE($E$3:$E$8)*1.15
Pivot Table
| Region | Category | Q1 | Q2 | Q3 | Q4 | YTD | Growth | Margin |
|---|---|---|---|---|---|---|---|---|
| North | Electronics | $125,000 | $145,000 | $138,000 | $152,000 | $560,000 | 12.5% | 18.2% |
| North | Fashion | $98,000 | $112,000 | $105,000 | $118,000 | $433,000 | 8.3% | 22.1% |
| North | Home | $85,000 | $92,000 | $88,000 | $95,000 | $360,000 | 5.7% | 15.8% |
| South | Electronics | $142,000 | $158,000 | $165,000 | $172,000 | $637,000 | 15.2% | 19.5% |
| South | Fashion | $115,000 | $128,000 | $132,000 | $145,000 | $520,000 | 10.8% | 24.3% |
| South | Home | $102,000 | $115,000 | $108,000 | $122,000 | $447,000 | 7.2% | 17.4% |
| East | Electronics | $108,000 | $125,000 | $118,000 | $135,000 | $486,000 | 9.8% | 16.9% |
| East | Fashion | $92,000 | $105,000 | $98,000 | $112,000 | $407,000 | 6.5% | 20.7% |
| East | Home | $78,000 | $88,000 | $85,000 | $92,000 | $343,000 | 4.1% | 14.2% |
| West | Electronics | $135,000 | $152,000 | $148,000 | $165,000 | $600,000 | 13.7% | 18.8% |
| West | Fashion | $108,000 | $122,000 | $118,000 | $132,000 | $480,000 | 9.2% | 23.5% |
| West | Home | $95,000 | $108,000 | $102,000 | $115,000 | $420,000 | 6.8% | 16.1% |
| Grand Total: | $1,265,000 | $1,438,000 | $1,383,000 | $1,548,000 | $5,634,000 | 10.2% | 18.7% | |
Active Formulas
G3: =SUM(C3:F3)
H3: =((F3-C3)/C3)*100
I3: =(E3-C3)/C3*100
E8: =SUMIFS($F$3:$F$14,$B$3:$B$14,"Electronics",$C$3:$C$14,">100000")+AVERAGE($G$3:$G$8)*1.15
G14: =AVERAGE(G3:G13)
H14: =SUMPRODUCT(G3:G13,H3:H13)/SUM(G3:G13)
Calculated Fields & References
Calc Field 1: Profit Margin = (Profit/Sales)*100
Calc Field 2: YoY Growth = ((Current-Previous)/Previous)*100
Dependencies: E8 → F3:F14, B3:B14
Precedents: G3 → C3, D3, E3, F3
Format: Currency ($), Percentage (%)
Validation: YTD > 0, Growth ≥ -100%
Voucher Creation Form
Party Details
Accounting Entries
| Account | Description | Debit | Credit | Tax | |
|---|---|---|---|---|---|
| Total: | 50,000 | 68,000 | 9,000 | ||
| Balance: | Unbalanced: 18,000 | ||||
Subtotal
₹41,000
Tax
₹9,000
Total Debit
₹50,000
Total Credit
₹68,000
Power Query & Power Pivot
Data Source
Queries
Sales_Data
12,500 rows•8 cols
Customer_Info
3,500 rows•5 cols
Product_Catalog
0 rows•0 cols
Applied Steps
Source
Removed Columns
Filtered Rows
Changed Type
Added Custom Column
Transformations
Relationships
Sales_DataCustomer_Info(Many-to-One)
Sales_DataProduct_Catalog(Many-to-One)
Query Name
Refresh
Stock Trading View
AAPL
Apple Inc.$175.43
+2.15 (+1.24%)
Open
$174.50
High
$176.20
Low
$173.80
Volume
45.2M
Price Chart
Order Book
175.441,800
175.451,200
175.46950
175.471,300
175.481,100
Spread
0.02
175.421,200
175.41850
175.402,100
175.391,500
175.38900
Recent Trades
10:45:23$175.43500
10:45:18$175.42300
10:45:12$175.44800
10:45:05$175.41200
10:44:58$175.43600
Technical Indicators
RSI (14)
58.42
MACD
+1.23
MA (20)
174.85
MA (50)
172.30
Bollinger
Upper
Volume
45.2M
Campaign Builder
Workflow
User Visits Page
If Cart Value > ₹1000
Send Email
Add Tag
Triggers
Actions
Conditions
Audience
Schedule
Performance
Budget
₹50,000
Spent
₹32,500
Impressions
125,000
Clicks
8,500
Conversions
450
CTR
6.80%
Bill of Materials Editor
Components
| Part No | Description | Qty | Unit | Unit Cost | Total Cost | |
|---|---|---|---|---|---|---|
Total Components
15
Assemblies
3
Total Cost
₹1,250
Advanced Filter Panel
Price Range
Categories
Brands
Color
Discount
Shipping
Availability
Active Filters
ElectronicsSonyBlackFree ShippingUnder ₹10,000
Hotel Booking System
Available Hotels
4 properties foundGrand Luxury Resort
Maldives
$450
/night
4.8
(1247 reviews)WiFiPoolSpaRestaurant
Mountain View Lodge
Swiss Alps
$320
/night
4.6
(892 reviews)WiFiSkiFireplaceRestaurant
Urban Boutique
New York
$280
/night
4.7
(2156 reviews)WiFiGymBarRoom Service
Tropical Paradise
Bali
$380
/night
4.9
(1834 reviews)WiFiBeachYogaSpa
3 nights × $450 =$1,350
Pivot Table Builder
Rows
RegionCategory
Columns
Quarter
Values
SalesGrowth
Filters
Status
E8
=SUMIFS($D$3:$D$12,$B$3:$B$12,"Electronics",$C$3:$C$12,">100000")+AVERAGE($E$3:$E$8)*1.15
Pivot Table
| Region | Category | Q1 | Q2 | Q3 | Q4 | YTD | Growth | Margin |
|---|---|---|---|---|---|---|---|---|
| North | Electronics | $125,000 | $145,000 | $138,000 | $152,000 | $560,000 | 12.5% | 18.2% |
| North | Fashion | $98,000 | $112,000 | $105,000 | $118,000 | $433,000 | 8.3% | 22.1% |
| North | Home | $85,000 | $92,000 | $88,000 | $95,000 | $360,000 | 5.7% | 15.8% |
| South | Electronics | $142,000 | $158,000 | $165,000 | $172,000 | $637,000 | 15.2% | 19.5% |
| South | Fashion | $115,000 | $128,000 | $132,000 | $145,000 | $520,000 | 10.8% | 24.3% |
| South | Home | $102,000 | $115,000 | $108,000 | $122,000 | $447,000 | 7.2% | 17.4% |
| East | Electronics | $108,000 | $125,000 | $118,000 | $135,000 | $486,000 | 9.8% | 16.9% |
| East | Fashion | $92,000 | $105,000 | $98,000 | $112,000 | $407,000 | 6.5% | 20.7% |
| East | Home | $78,000 | $88,000 | $85,000 | $92,000 | $343,000 | 4.1% | 14.2% |
| West | Electronics | $135,000 | $152,000 | $148,000 | $165,000 | $600,000 | 13.7% | 18.8% |
| West | Fashion | $108,000 | $122,000 | $118,000 | $132,000 | $480,000 | 9.2% | 23.5% |
| West | Home | $95,000 | $108,000 | $102,000 | $115,000 | $420,000 | 6.8% | 16.1% |
| Grand Total: | $1,265,000 | $1,438,000 | $1,383,000 | $1,548,000 | $5,634,000 | 10.2% | 18.7% | |
Active Formulas
G3: =SUM(C3:F3)
H3: =((F3-C3)/C3)*100
I3: =(E3-C3)/C3*100
E8: =SUMIFS($F$3:$F$14,$B$3:$B$14,"Electronics",$C$3:$C$14,">100000")+AVERAGE($G$3:$G$8)*1.15
G14: =AVERAGE(G3:G13)
H14: =SUMPRODUCT(G3:G13,H3:H13)/SUM(G3:G13)
Calculated Fields & References
Calc Field 1: Profit Margin = (Profit/Sales)*100
Calc Field 2: YoY Growth = ((Current-Previous)/Previous)*100
Dependencies: E8 → F3:F14, B3:B14
Precedents: G3 → C3, D3, E3, F3
Format: Currency ($), Percentage (%)
Validation: YTD > 0, Growth ≥ -100%
Voucher Creation Form
Party Details
Accounting Entries
| Account | Description | Debit | Credit | Tax | |
|---|---|---|---|---|---|
| Total: | 50,000 | 68,000 | 9,000 | ||
| Balance: | Unbalanced: 18,000 | ||||
Subtotal
₹41,000
Tax
₹9,000
Total Debit
₹50,000
Total Credit
₹68,000
Power Query & Power Pivot
Data Source
Queries
Sales_Data
12,500 rows•8 cols
Customer_Info
3,500 rows•5 cols
Product_Catalog
0 rows•0 cols
Applied Steps
Source
Removed Columns
Filtered Rows
Changed Type
Added Custom Column
Transformations
Relationships
Sales_DataCustomer_Info(Many-to-One)
Sales_DataProduct_Catalog(Many-to-One)
Query Name
Refresh
Stock Trading View
AAPL
Apple Inc.$175.43
+2.15 (+1.24%)
Open
$174.50
High
$176.20
Low
$173.80
Volume
45.2M
Price Chart
Order Book
175.441,800
175.451,200
175.46950
175.471,300
175.481,100
Spread
0.02
175.421,200
175.41850
175.402,100
175.391,500
175.38900
Recent Trades
10:45:23$175.43500
10:45:18$175.42300
10:45:12$175.44800
10:45:05$175.41200
10:44:58$175.43600
Technical Indicators
RSI (14)
58.42
MACD
+1.23
MA (20)
174.85
MA (50)
172.30
Bollinger
Upper
Volume
45.2M
Campaign Builder
Workflow
User Visits Page
If Cart Value > ₹1000
Send Email
Add Tag
Triggers
Actions
Conditions
Audience
Schedule
Performance
Budget
₹50,000
Spent
₹32,500
Impressions
125,000
Clicks
8,500
Conversions
450
CTR
6.80%
Bill of Materials Editor
Components
| Part No | Description | Qty | Unit | Unit Cost | Total Cost | |
|---|---|---|---|---|---|---|
Total Components
15
Assemblies
3
Total Cost
₹1,250
Bill of Materials Editor
Components
| Part No | Description | Qty | Unit | Unit Cost | Total Cost | |
|---|---|---|---|---|---|---|
Total Components
15
Assemblies
3
Total Cost
₹1,250
Advanced Filter Panel
Price Range
Categories
Brands
Color
Discount
Shipping
Availability
Active Filters
ElectronicsSonyBlackFree ShippingUnder ₹10,000
Pivot Table Builder
Rows
RegionCategory
Columns
Quarter
Values
SalesGrowth
Filters
Status
E8
=SUMIFS($D$3:$D$12,$B$3:$B$12,"Electronics",$C$3:$C$12,">100000")+AVERAGE($E$3:$E$8)*1.15
Pivot Table
| Region | Category | Q1 | Q2 | Q3 | Q4 | YTD | Growth | Margin |
|---|---|---|---|---|---|---|---|---|
| North | Electronics | $125,000 | $145,000 | $138,000 | $152,000 | $560,000 | 12.5% | 18.2% |
| North | Fashion | $98,000 | $112,000 | $105,000 | $118,000 | $433,000 | 8.3% | 22.1% |
| North | Home | $85,000 | $92,000 | $88,000 | $95,000 | $360,000 | 5.7% | 15.8% |
| South | Electronics | $142,000 | $158,000 | $165,000 | $172,000 | $637,000 | 15.2% | 19.5% |
| South | Fashion | $115,000 | $128,000 | $132,000 | $145,000 | $520,000 | 10.8% | 24.3% |
| South | Home | $102,000 | $115,000 | $108,000 | $122,000 | $447,000 | 7.2% | 17.4% |
| East | Electronics | $108,000 | $125,000 | $118,000 | $135,000 | $486,000 | 9.8% | 16.9% |
| East | Fashion | $92,000 | $105,000 | $98,000 | $112,000 | $407,000 | 6.5% | 20.7% |
| East | Home | $78,000 | $88,000 | $85,000 | $92,000 | $343,000 | 4.1% | 14.2% |
| West | Electronics | $135,000 | $152,000 | $148,000 | $165,000 | $600,000 | 13.7% | 18.8% |
| West | Fashion | $108,000 | $122,000 | $118,000 | $132,000 | $480,000 | 9.2% | 23.5% |
| West | Home | $95,000 | $108,000 | $102,000 | $115,000 | $420,000 | 6.8% | 16.1% |
| Grand Total: | $1,265,000 | $1,438,000 | $1,383,000 | $1,548,000 | $5,634,000 | 10.2% | 18.7% | |
Active Formulas
G3: =SUM(C3:F3)
H3: =((F3-C3)/C3)*100
I3: =(E3-C3)/C3*100
E8: =SUMIFS($F$3:$F$14,$B$3:$B$14,"Electronics",$C$3:$C$14,">100000")+AVERAGE($G$3:$G$8)*1.15
G14: =AVERAGE(G3:G13)
H14: =SUMPRODUCT(G3:G13,H3:H13)/SUM(G3:G13)
Calculated Fields & References
Calc Field 1: Profit Margin = (Profit/Sales)*100
Calc Field 2: YoY Growth = ((Current-Previous)/Previous)*100
Dependencies: E8 → F3:F14, B3:B14
Precedents: G3 → C3, D3, E3, F3
Format: Currency ($), Percentage (%)
Validation: YTD > 0, Growth ≥ -100%
Power Query & Power Pivot
Data Source
Queries
Sales_Data
12,500 rows•8 cols
Customer_Info
3,500 rows•5 cols
Product_Catalog
0 rows•0 cols
Applied Steps
Source
Removed Columns
Filtered Rows
Changed Type
Added Custom Column
Transformations
Relationships
Sales_DataCustomer_Info(Many-to-One)
Sales_DataProduct_Catalog(Many-to-One)
Query Name
Refresh
Stock Trading View
AAPL
Apple Inc.$175.43
+2.15 (+1.24%)
Open
$174.50
High
$176.20
Low
$173.80
Volume
45.2M
Price Chart
Order Book
175.441,800
175.451,200
175.46950
175.471,300
175.481,100
Spread
0.02
175.421,200
175.41850
175.402,100
175.391,500
175.38900
Recent Trades
10:45:23$175.43500
10:45:18$175.42300
10:45:12$175.44800
10:45:05$175.41200
10:44:58$175.43600
Technical Indicators
RSI (14)
58.42
MACD
+1.23
MA (20)
174.85
MA (50)
172.30
Bollinger
Upper
Volume
45.2M
Voucher Creation Form
Party Details
Accounting Entries
| Account | Description | Debit | Credit | Tax | |
|---|---|---|---|---|---|
| Total: | 50,000 | 68,000 | 9,000 | ||
| Balance: | Unbalanced: 18,000 | ||||
Subtotal
₹41,000
Tax
₹9,000
Total Debit
₹50,000
Total Credit
₹68,000
Campaign Builder
Workflow
User Visits Page
If Cart Value > ₹1000
Send Email
Add Tag
Triggers
Actions
Conditions
Audience
Schedule
Performance
Budget
₹50,000
Spent
₹32,500
Impressions
125,000
Clicks
8,500
Conversions
450
CTR
6.80%
Hotel Booking System
Available Hotels
4 properties foundGrand Luxury Resort
Maldives
$450
/night
4.8
(1247 reviews)WiFiPoolSpaRestaurant
Mountain View Lodge
Swiss Alps
$320
/night
4.6
(892 reviews)WiFiSkiFireplaceRestaurant
Urban Boutique
New York
$280
/night
4.7
(2156 reviews)WiFiGymBarRoom Service
Tropical Paradise
Bali
$380
/night
4.9
(1834 reviews)WiFiBeachYogaSpa
3 nights × $450 =$1,350
Hard UX = Lost Sales and Inefficient Operations
People can do task by just chatting. instead of menus, forms, workflows, or buttons.
How We Solve This Problem
GO AGENTIC
The usual way
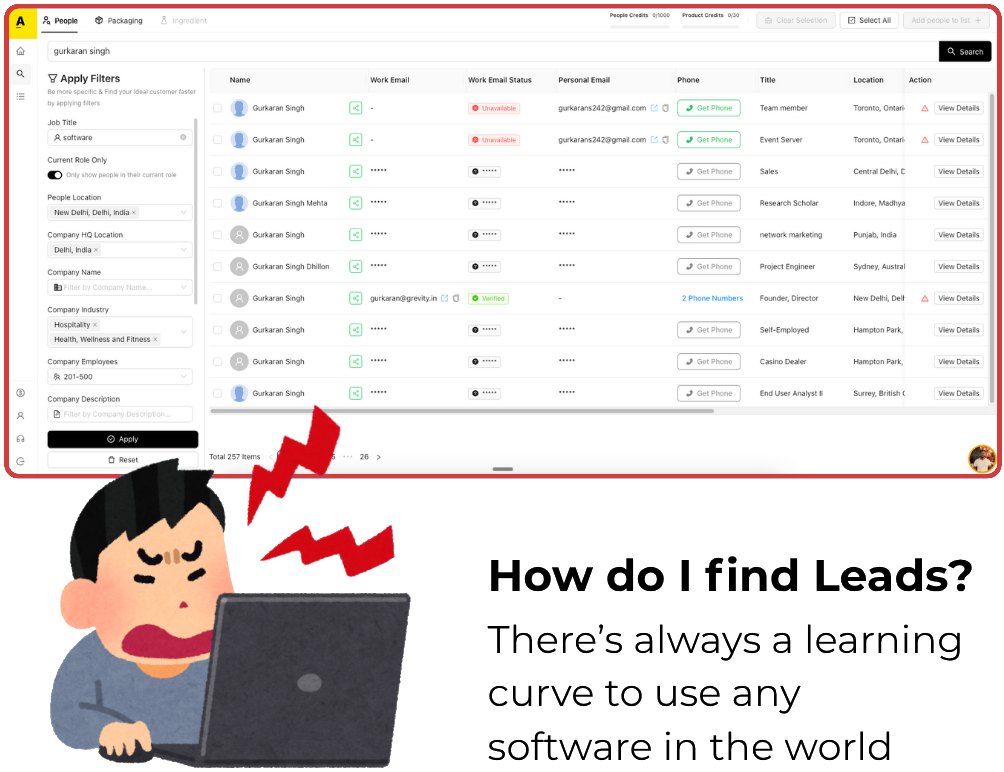
The Agentic way
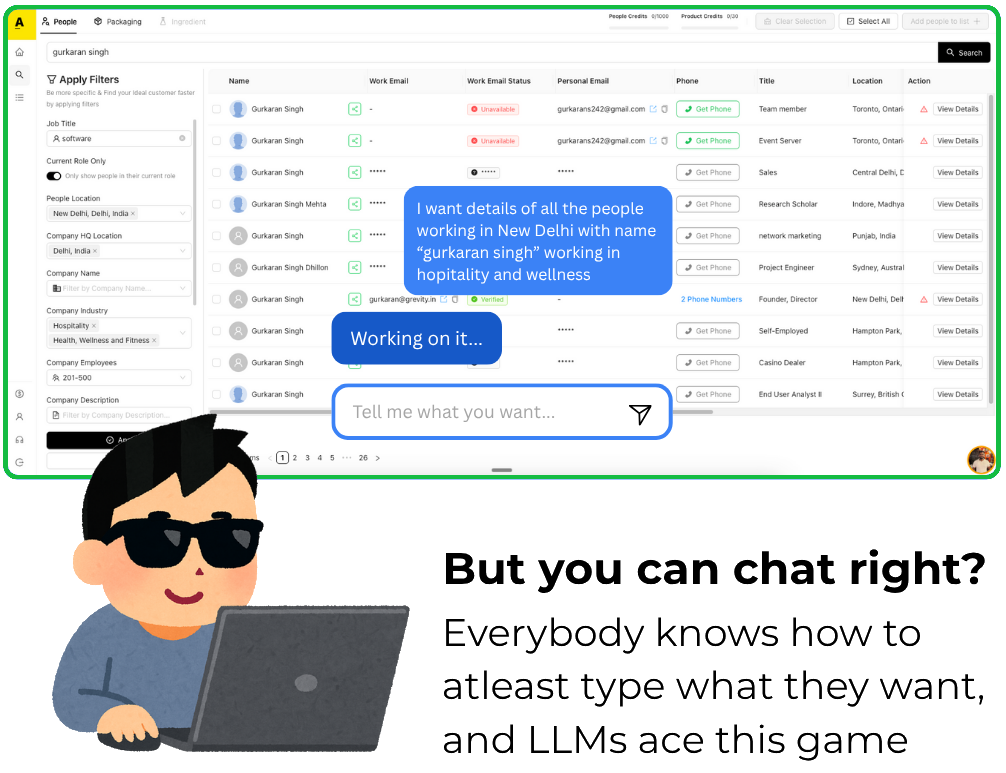
Every Software, Now as Simple as Texting
Talk to Your Books, Not Through Them
Stop clicking through endless menus. Generate P&L statements, track expenses, and reconcile accounts by simply asking. Your accountant, but instant and always available.
Run Your Hotel Like You're Texting a Friend
Forget complex booking systems with 47 clicks. Check availability, manage reservations, and handle guest requests through natural conversation. Hospitality made actually hospitable.
Ask Your Data Anything. Get Instant Answers.
No SQL. No pivot tables. No complicated dashboards. Just ask "What were my top products last quarter?" and watch the insights appear. Your entire analytics team in a chat window.
🤖
Scroll down to start demo...
Frequently Asked Questions
Everything you need to know about UXeazy
Get in Touch
Have questions? We'd love to hear from you.